|
原标题:考研英语大作文|图表作文 柱形多参数对比(上)
考 研 英 语 作 文 中 文 思 路 训 练 ✦
从11.11号开始,文仔不定时连续给大家分享大小作文的写作思路,供大家平时积累以及养成写作的思路。
小作文或大作文穿插更新,而且带有一个小练习,加上每日功能句,不会浪费大家时间,希望大家能够跟上学习!
注意:看完思路之后,下面会有每日一练,请大家先自己翻译一下,再看答案,对自己负责!大家一定要去练习形成自己的作文思路模板,要记入脑子里,转变成自己的素材。
大作文思路
图表作文 柱形多参数对比

【第一段】
(总述)
Given is a column chart, clearly illustrating the remarkable contrasts among and from to .
所给是一个柱状图,清晰展示了 在 从 到 时候的明显差异。
(描述图表)
先说变化之处During the period, the percentage of showed a significant (上升或下降), from to approximately .
在此时间, 的份额表现出明显的 ,从 到大概 。
再说不变之处Meanwhile/ In the meantime, the proportion of remained stable at .
同时, 的比例稳定在 。
对比明显之处By contrast, the share of descended sharply, from the peak of to .
相反, 的份额下降(上升)明显,从最高值的 降至 。
【第二段上】
图表联系实际
Such statistics can be associated with the fierce competition in/of ,but what resulted in the differences above? (万能句)
上述的数据能被联系到 的激烈竞争 ,但是什么导致了上述差异?
![]()
每日一练
先自己做哦~
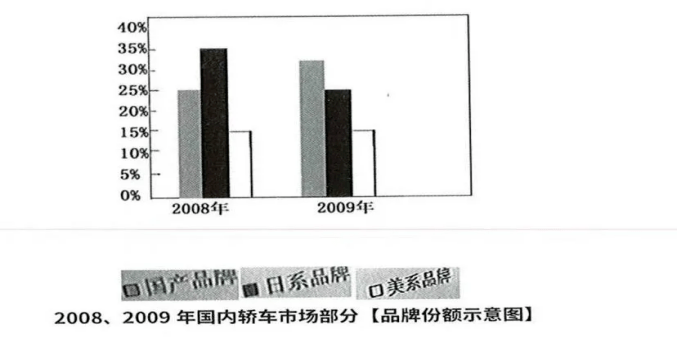
所给是一个柱状图,清晰展示了 2008 和 2009 年的中、美、日系汽车品牌在中国汽车市场的份额明显差异。
Given is a column chart that clearly illustrates the dramatic changes/ striking contrasts in the China's market share among Chinese, American and Japanese automobile brands between 2008 and 2009.
每日功能句
每天积累!
But what resulted in the differences above?
但什么导致了以上差异?
Such a scenario can be naturally associated with the fierce competitionin China's car market.
这样的场景能自然联系到中国汽车市场的激烈竞争.
illustrates the dramatic changes/ striking contrasts
表现出强烈的对比/差异
责任编辑:
沪学网考研课程全免费,首家、全免费、全网实时更新!

|  /1
/1 